

Darren Hails digs into the Tampa Bay win and the opening three weeks of PFF data: where the pressure really paid off, why two sacks flatter one performance, and the passing plays that keep completing without moving the chains.
Edition 1 · Week 3: Vikings 23–16 Buccaneers · Regular-season data through 27 September 2026
Grades and charted performance data are from PFF Premium Stats. Combined totals and rates are calculated from the opening three regular-season game reports.
Six sacks, an 86-yard punt-return touchdown and another win. Lovely. But Tampa’s five starting offensive linemen were charged with only five pressures between them. Kyler Murray, meanwhile, had a better passer rating under pressure than from a clean pocket, despite completing just two passes when pressured.
Those numbers don’t sit comfortably together until you pull them apart. That’s the job of From Beyond the Grade: take the game we’ve just watched, get properly geeky with the figures, then work out which findings survive when we add the rest of the season.
Minnesota’s 23–16 win took the Vikings to 3–0. The closer examination shows an exceptionally destructive pressure game, a passing offense living on a narrow set of productive throws, and some useful individual work that the bigger moments could easily overshadow. Vikings.com game report.
Part 1: Inside the Tampa Bay game
Six sacks, but the line wasn’t losing everywhere
Let’s start with Baker Mayfield’s 42 dropbacks. PFF charted pressure on 15, or 35.7%. Those pressured plays produced six sacks. That’s a 40% pressure-to-sack rate: Minnesota finished the disruption with remarkable efficiency.
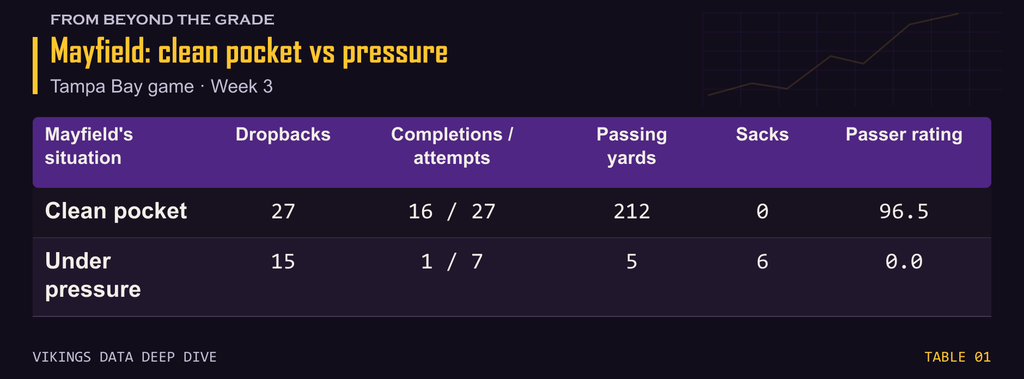
The passing production fell from 7.9 yards per attempt when clean to 0.7 under pressure. That second figure still excludes the sacks: five passing yards across 15 pressured dropbacks is only 0.33 passing yards per dropback, before subtracting sack yardage. The other two dropbacks were scrambles. Tampa could move the ball when Mayfield was undisturbed; Minnesota made the disrupted plays almost completely barren.
Now add the blitz split. Flores sent extra rushers on 30 of those 42 dropbacks, a 71.4% blitz rate. They generated 12 pressures and all six sacks. On the 12 non-blitzed dropbacks, Mayfield faced three pressures and took no sacks. The pressure rates were 40% with the blitz and 25% without it. More strikingly, half the pressures on blitzed plays became sacks.
This wasn’t a case of every Tampa lineman being overwhelmed. All five starters graded at least 75.1 in pass protection. PFF charged them with five pressures and two sacks collectively. Bucky Irving and Cade Otton were each charged with a sack, while Kenneth Gainwell allowed two pressures and Payne Durham one.
Those blocker credits aren’t a complete allocation of every team pressure – multiple players can be involved in the same disrupted play – but they locate weaknesses outside the five-man line and explain why the team sack total alone gives a misleading picture of the matchup. Flores’ pressure package punished the wider protection operation, rather than relying on repeated losses by all five starters.
There was a price: Mayfield still threw for 177 yards and a touchdown against the blitz. Minnesota accepted some productive throws in exchange for six drive-damaging sacks. On this afternoon, the finishing justified the aggression.
Murray’s 91.7 rating hides six attempts for one yard
Murray’s pressure split appears to tell the opposite story: a 91.7 passer rating under pressure, against 56.3 when clean. Here’s what actually produced it:
Under pressure, he completed two of seven attempts for 42 yards and a touchdown. Addison’s 41-yard score supplied 97.6% of those yards. Remove that one play as a check on how concentrated the production was, and the other six attempts produced one completion for one yard. Three sacks and a scramble complete the 11 pressured dropbacks.
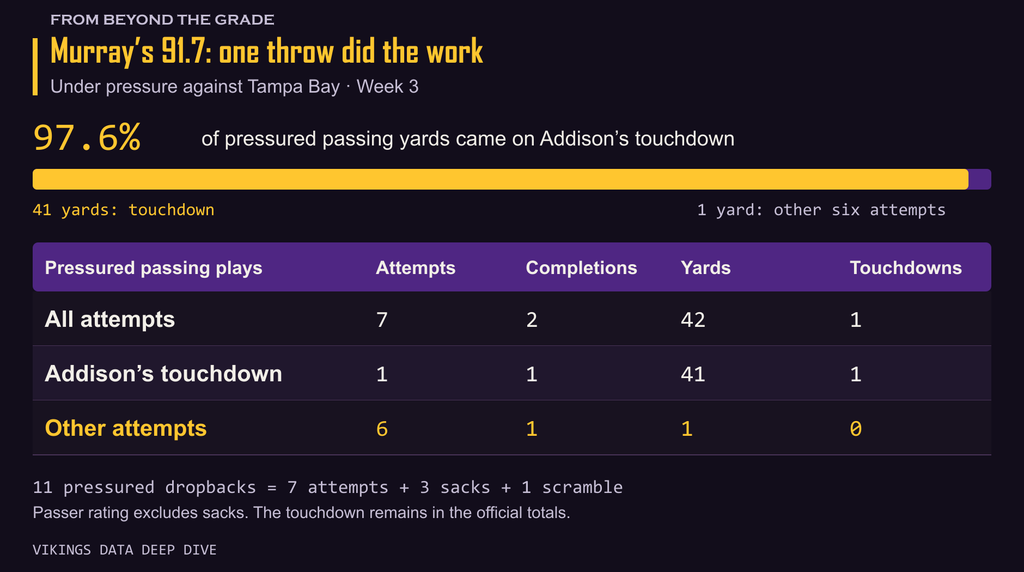
The touchdown stays on the scoreboard, obviously. The finding is that the healthy-looking rating describes one excellent result surrounded by almost no passing production. Passer rating also doesn’t debit sacks, so it misses another substantial part of the damage.
The protection report adds a second surprise. Minnesota’s starting line allowed five pressures, all hurries, with no sacks charged to it. O’Neill allowed none on 34 eligible pressure opportunities. Darrisaw, Brandel and Fries allowed one each; Jackson allowed two. Jones allowed none on seven opportunities, while Dallas allowed two hurries on five and Bredeson one on his single opportunity.
Murray’s average time to throw rose from 2.77 seconds when clean to 4.57 when pressured. That association doesn’t establish whether holding the ball caused the pressure or pressure extended the play. Combined with the blocker credits, though, it rules out a neat explanation in which the starting line simply collapsed.
Tampa’s blitzes make the diagnosis more interesting still. They generated pressure on four of 15 dropbacks (26.7%), compared with seven of 19 without a blitz (36.8%). Yet Murray’s passer rating fell from 88.0 without a blitz to 39.9 against it. The extra rushers weren’t producing pressure more often; the passing results were worse anyway. Coverage, identification and the available throws belong in the explanation alongside blocking.
The offense had a deep ball and very little in between
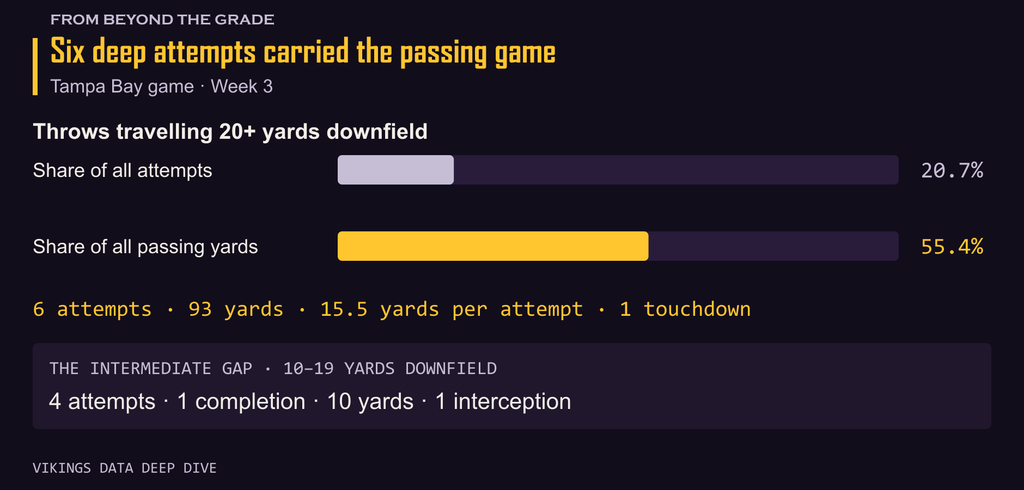
Murray’s six attempts travelling at least 20 yards downfield produced 93 yards and the touchdown. That was 55.4% of all his passing yardage from 20.7% of his attempts. The four intermediate attempts, travelling 10–19 yards, produced one completion for ten yards and an interception.
Down underneath, five of six screens were completed for 28 yards. None produced a passing first down. So we had a productive deep-shot component, a largely absent intermediate game and screens that got caught without moving the chains.
The receiving workloads show where the missing production sat.
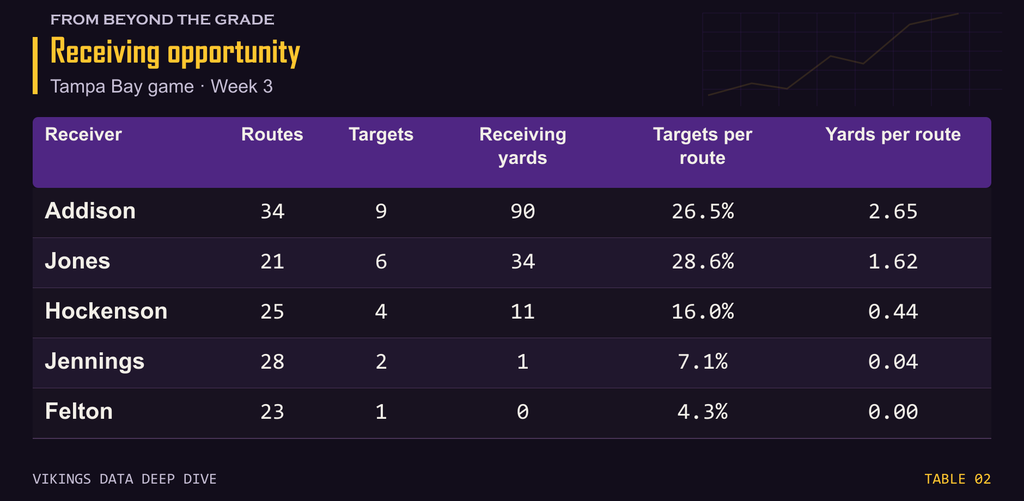
Jefferson’s two routes produced 32 yards before his injury, but that tiny workload would distort this comparison. Across 76 combined routes, Hockenson, Jennings and Felton produced 12 receiving yards from seven targets. These are player-route opportunities, not 76 separate pass plays: several players run routes on the same snap.
The problem was partly opportunity. Jennings and Felton combined for only three targets on 51 routes. Hockenson received four chances, but his two catches averaged 5.5 yards. The figures show an offense getting little return from a substantial amount of route-running beyond Addison and Jones. They don’t establish whether separation, reads or play design caused it.
Jones’ five catches are revealing too. PFF credited him with 43 yards after the catch, yet he finished with 34 receiving yards. The difference means his catches started an aggregate nine yards behind the line of scrimmage. He had to recover that ground before adding anything to the passing total.
The hidden defensive work: squeezing the run and holding the outside
Irving’s 46 yards on 15 carries look like a quiet rushing afternoon. Of those, 40 came after contact, leaving only 6 before contact: 0.4 per carry. Gainwell added negative-four rushing yards, despite four after contact. Together, Tampa’s backs gained 42 yards on 18 carries, with 44 after contact. Their combined net yardage before contact was negative-two.
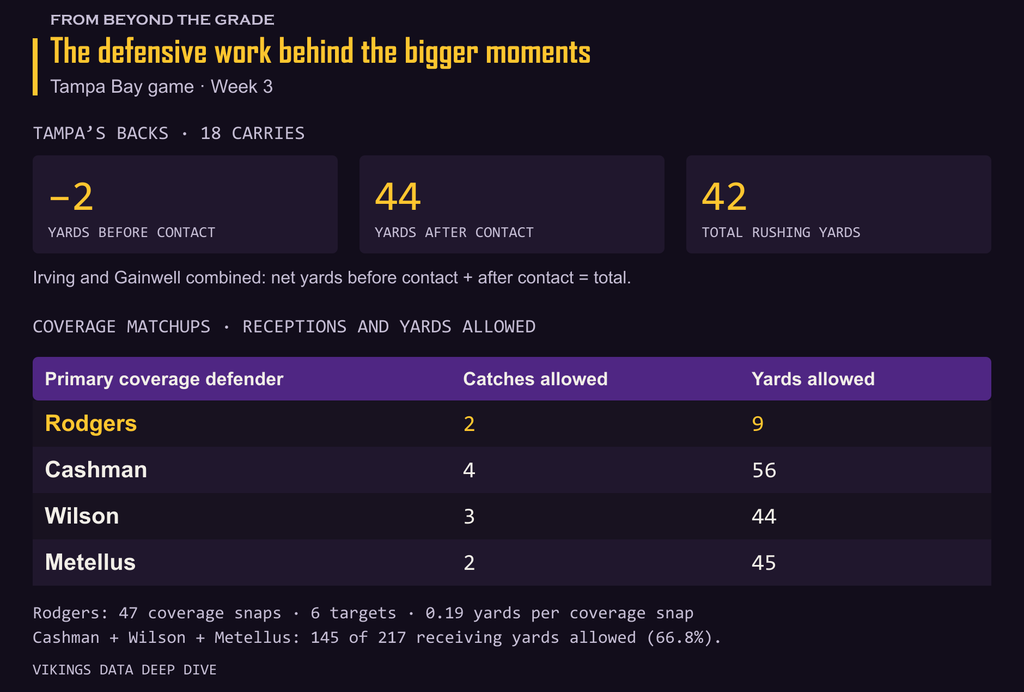
That’s a much stronger account of Minnesota’s run defense than the total alone. Across those carries, the backs were losing ground before contact on aggregate and recovering it afterwards. Jalen Redmond’s 84.9 run-defense grade came on 16 run-defense snaps; Van Noy’s 90.9 came on six. Redmond supplied more of the sustained workload, while Van Noy excelled in his smaller assignment.
Rodgers’ interception was the obvious coverage moment. His other numbers are just as encouraging: 47 coverage snaps, six targets, two completions and nine yards allowed. That’s 1.5 yards per target and 0.19 per coverage snap. He was tested often enough for the low yardage to mean more than simply being ignored.
The softer matchups were elsewhere. Cashman, Wilson and Metellus were the primary coverage defenders on 145 of Tampa’s 217 receiving yards, a ratio of 66.8%. Cashman allowed four catches for 56 yards; Wilson three for 44; Metellus two for 45. Their nine completions allowed averaged 16.1 yards each.
This locates the vulnerability in particular linebacker and safety matchups, rather than spreading it across the secondary. Rodgers largely closed his assignments down; Tampa’s more productive completions came against that second-level group. Assignment charting doesn’t prove why every matchup occurred, but it gives us a far clearer finding than saying the defense occasionally allowed an explosive play.
Turner’s two sacks conceal a quieter pressure game
Turner and Wilson each had five pressures and two PFF sack credits. Turner needed 41 rushes; Wilson needed 18. Their pressure rates were 12.2% and 27.8% respectively. Matching totals concealed very different opportunities.
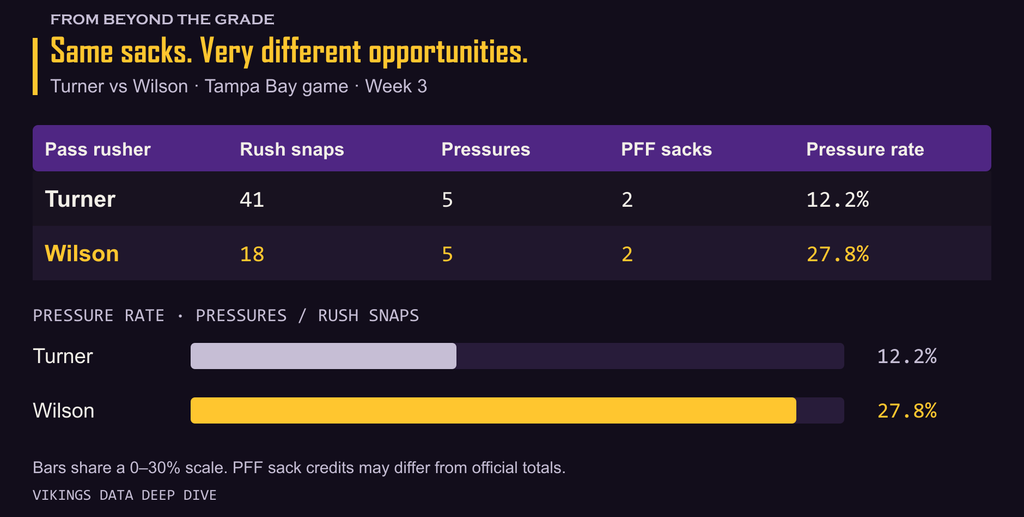
Turner’s two sacks converted 40% of his five pressures. That helped rescue the visible production from an afternoon when he disrupted a smaller proportion of his rushes. His 62.8 pass-rush grade also sat above his 53.8 overall grade: run defense graded 47.9, tackling 33.9, with one missed tackle and a penalty.
The lower overall grade therefore wasn’t dismissing two sacks. It was recording weaker work around them, while even the rush itself was less consistently productive than his preceding games. PFF sack credits can differ from official totals, so they shouldn’t be added together to manufacture a team sack count.
Price supplies another concentrated result. His touchdown accounted for 81.1% of his 106 punt-return yards. The other three returns averaged 6.7 yards, against the headline 26.5. Dixon averaged 47.3 yards gross punting but 35.6 net, while Hekker finished at 41.5 net. Minnesota’s return work helped turn a slightly lower gross punting average into a 5.9-yard advantage in net averages. That comparison includes the touchdown’s yardage; it isn’t an extra benefit to add on top of it.
Part 2: The patterns across all three games
These totals combine Weeks 1–3, including both quarterbacks in the opener. Rates use the accumulated opportunities. Weekly grades remain separate; averaging them would not produce PFF’s official season grade.
The screens are a recurring dead end; play action is improving
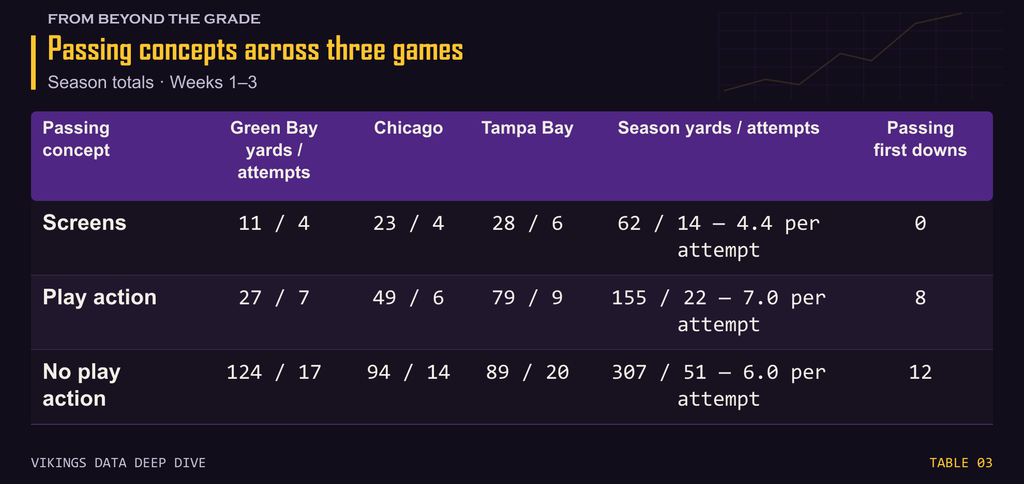
Screens and play action are different filters and can overlap; these rows mustn’t be added together as separate buckets.
The screens are completing: 11 of 14, or 78.6%. They account for 19.2% of all Minnesota’s pass attempts, yet have produced no passing first downs in any of the three games. The other 59 attempts have produced 400 yards, or 6.8 per attempt.
A screen can have a situational purpose beyond gaining a first down, and we don’t have the down-and-distance breakdown here. Even with that limitation, the combination of substantial usage, high completion percentage and zero passing first downs is a recurring weakness. The easy completions are doing little to support the rest of the offense.
Play action has moved in the opposite direction: 3.9 yards per attempt against Green Bay, 8.2 against Chicago and 8.8 against Tampa. Its cumulative advantage is only about a yard per attempt, because the opener was poor. The more recent games strengthen the case for it; a season average alone would conceal that improvement. Different quarterbacks and opponents prevent us from attributing all of the change to the concept itself.
Pressure damages the offense more than the completion totals show
Across the season, Minnesota has 462 passing yards on 73 attempts. Split the work by pocket conditions and the weakness becomes much sharper.
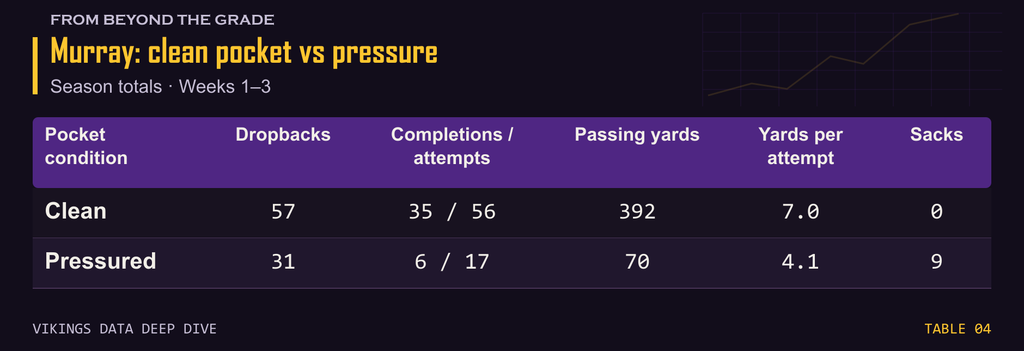
Completion percentage falls from 62.5% to 35.3%. But those 17 pressured attempts tell only part of the story: nine of the 31 pressured dropbacks ended in sacks, a 29.0% conversion rate. The passing yield is 2.3 yards per pressured dropback before sack losses. Clean pockets supplied 84.8% of the team’s passing yardage.
Addison’s Tampa touchdown alone accounts for 58.6% of Minnesota’s pressured passing yards for the entire season. Across the other 16 pressured attempts, Minnesota has five completions for 29 yards. That’s a serious concentration of production around one play, even allowing for a small sample.
There is a quieter positive in the protection. O’Neill allowed two pressures on 30 opportunities against Green Bay, then none on 24 against Chicago and none on 34 against Tampa Bay. His last 58 eligible opportunities have been pressure-free. His weekly pass-blocking grades rose from 56.9 to 83.2 and 86.0. The grades and the pressure counts agree that his work improved after the opener.
O’Neill has become more dependable while the passing offense still loses substantial production when disruption reaches the quarterback. His improvement is visible in the individual protection data even though the team passing results remain poor.
Turner’s pressures and blocker wins are moving apart
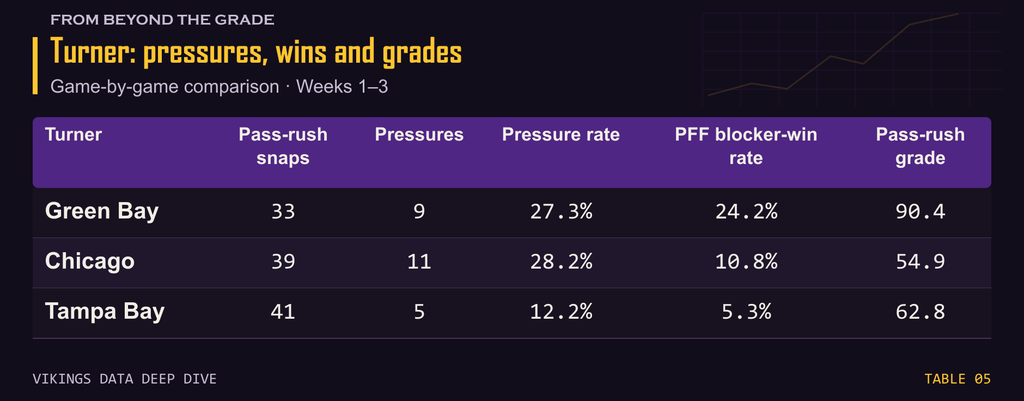
The pressure rate here is pressures divided by total rush snaps. PFF’s blocker-win percentage uses non-penalty rush snaps, so the denominators aren’t identical. It evaluates wins against blocking, rather than simply counting occasions when the quarterback was disturbed.
Chicago’s pressure rate stayed slightly above Green Bay’s, while the blocker-win rate more than halved. Against Tampa, both fell. The sack count stayed at two in the last two games because Turner converted a larger share of fewer pressures in Tampa.
This gives us a firmer explanation for the grade disagreement. His disruption has remained valuable, but the data does not describe three equally dominant performances against blockers. PFF explains that a pressure can occur without a positively graded win, including unblocked or clean-up opportunities; a win can also occur without a pressure. We can’t label individual Turner plays from these tables, but we can identify that his pressure production and evaluated blocker wins are diverging.
There’s an encouraging result when we isolate true pass sets, PFF’s filter for more conventional passing situations that removes plays such as screens and play action. Turner has 15 pressures on 51 rushes in that subset (29.4%), compared with 10 on the other 62 rushes (16.1%). His season production isn’t confined to the excluded quick or deceptive concepts. Opponent and game context still affect both groups.
Turner has 25 pressures overall. Cashman and Wilson have added 18 between them on 99 combined rushes, or 18.2%, with four combined PFF sack credits. That identifies another substantial source of disruption alongside the edge rush. Wilson’s Tampa performance was the latest contribution to a season total built from several roles.
Jones’ Tampa decline came after contact
Jones’ 203 yards on 52 carries give him a 3.9 average. His Chicago total supplies more than half the yards, but splitting each carry’s yardage reveals a more specific change.
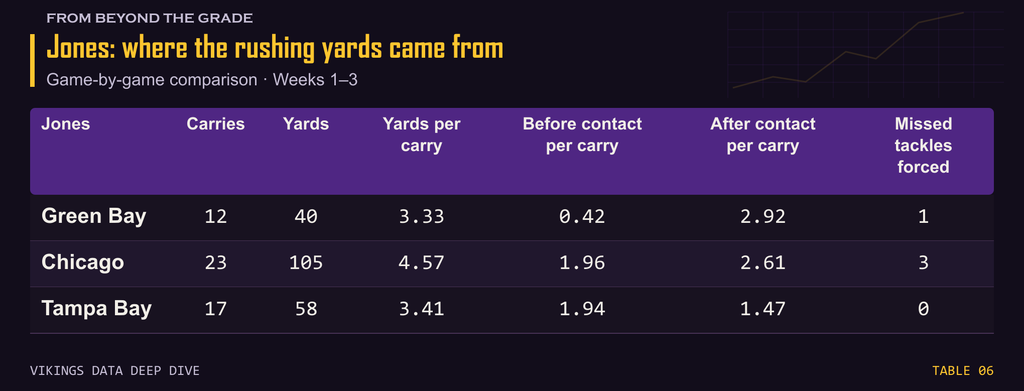
His space before contact improved substantially after Green Bay. It then stayed almost unchanged between Chicago and Tampa: 1.96 versus 1.94 yards per carry. Nearly the whole fall from 4.57 to 3.41 came after contact, where his average dropped by 1.16 yards. Forced missed tackles fell from three to none.
So the lower Tampa rushing average can’t be explained simply by Jones meeting defenders earlier than in Chicago. On his carries, the average point of contact barely changed. The production after contact did. That measures the outcome of those collisions; it doesn’t isolate Jones from tackling quality, angles or the situations in which contact occurred.
The Tampa direction chart reveals why the overall before-contact average needs care too. Four runs to the two outer-edge lanes gained 26 yards, 6.5 per carry. The other 13 gained 32, 2.5 per carry. Within that second group, the five lanes from left tackle through right guard produced just 15 yards on 11 attempts, 1.4 per carry. The middle-right lane’s two carries for 17 yards were the other productive pocket.
The result was a run game with particular lanes working, rather than steady output across the formation. Fries’ 80.3 run-blocking grade and Jackson’s 71.7 were individual positives, while Darrisaw, O’Neill and Hockenson graded 43.8, 40.6 and 32.0 respectively. The grades show uneven execution; the direction chart shows uneven results. They don’t let us assign a particular lane’s yardage to one blocker.
The season finding is more precise than “the running game went backwards”: Jones received more average space after Week 1, retained it in Tampa, but generated less yardage after contact, while productive lanes concealed several unproductive ones.
Jefferson’s efficiency remains strong; Oliver is the small-sample gem
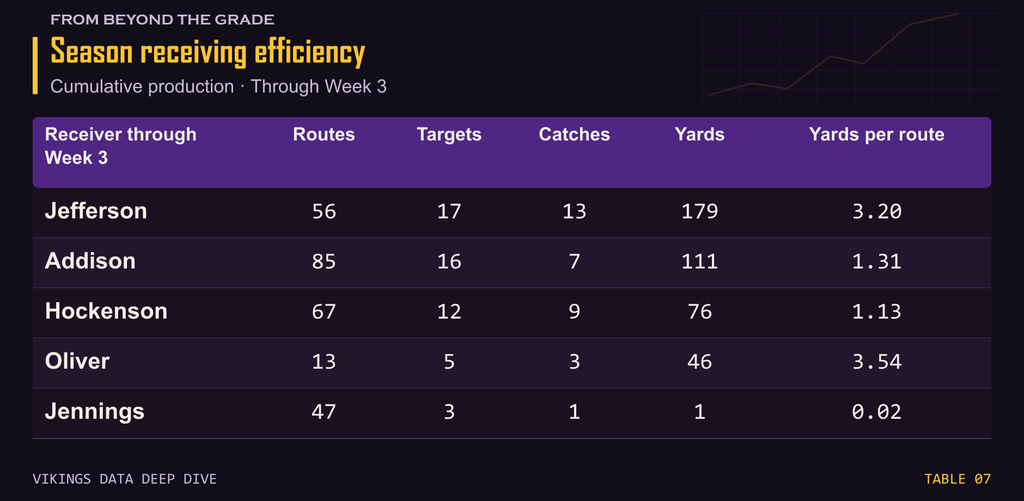
Yards per route includes routes on which the player wasn’t targeted, giving us production relative to receiving opportunity rather than just yards per catch.
Jefferson’s total looks modest after the short Tampa appearance, but he has generated 38.7% of Minnesota’s passing yards on 56 routes. Addison has run 29 more routes for 68 fewer yards. Tampa improved Addison’s position sharply: his first two games produced 21 yards on 51 routes, 0.41 per route, before his 90 on 34 lifted the cumulative rate to 1.31.
Oliver is the intriguing smaller contribution: 22 yards on nine routes against Green Bay, then 24 on four against Chicago. His three catches account for almost 10% of the team’s passing yards despite only 13 routes. The 3.54 yards-per-route average exceeds Jefferson’s, but one fewer 24-yard catch would change it dramatically. It identifies productive use of limited opportunities, not evidence that Oliver is the superior receiver.
Jennings’ problem is almost the reverse: three targets across 47 routes, a 6.4% target rate, and one yard. His blocking contribution belongs in a separate assessment; as a receiving option, he’s barely been involved. Hockenson has received four targets in each game, but his yards per route fell from 1.57 to 1.53 to 0.44. His Tampa dip reflects weaker output from a larger route workload, rather than simply fewer routes.
Those findings give us specific progress to measure next time. Do the screens finally generate first downs? Can the passing game produce under pressure without one deep touchdown supplying most of the yardage? Does Turner restore his blocker-win rate, and do Jennings and Hockenson provide more return from their routes?
I’ll happily celebrate another win. These figures will tell us whether the offense is beginning to give itself more ways to earn one.