

Darren Hails looks beneath the grades from the Dolphins win, then checks which changes hold up against Minnesota’s first four games.
Week 4: Vikings 15–10 Dolphins · Regular-season data through 4 October 2026
Grades and charted data are from PFF Premium Stats. Season totals and rates are calculated from the four weekly game reports.
Five field goals and no touchdowns doesn’t sound like much of an offensive breakthrough, but the numbers underneath Minnesota’s fourth win show movement in some of the areas we were worrying about last week.
T. J. Hockenson finally had a game worthy of his route workload, Kyler Murray was much better when the pocket stayed clean, and Dallas Turner’s two sacks came with a very different pressure performance. There are still gaps. We can be pleased about the improvement without pretending the offense is sorted.
Part 1: Inside the Miami game
Hockenson found the linebackers, and kept finding them
T. J. Hockenson’s 13 catches for 119 yards earned a 91.3 receiving grade. The matchup breakdown gives us a more useful explanation than the grade alone: Miami linebackers Jordyn Brooks and Jacob Rodriguez were the primary coverage defenders on 10 of those catches, for 96 yards (80.7% of his total).
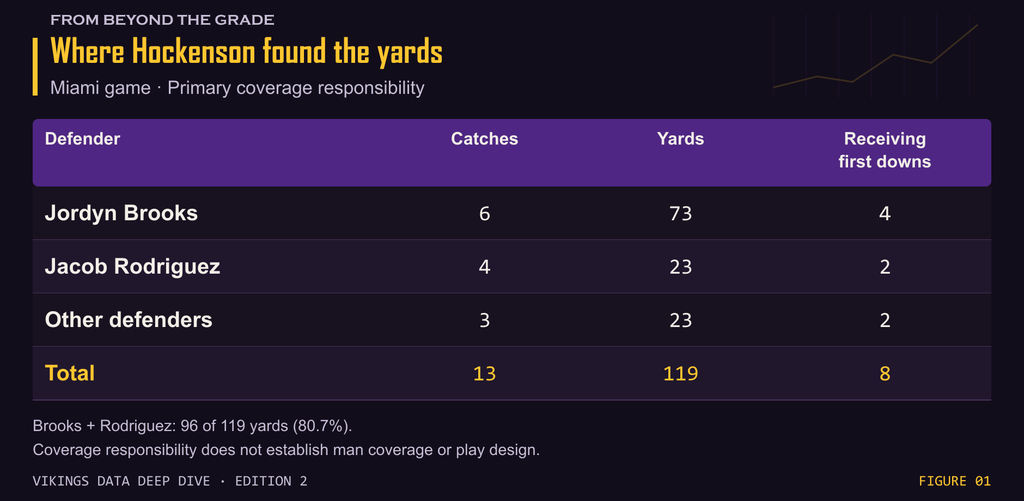
Brooks took the bigger damage, allowing six catches for 73 yards to Hockenson alone. Rodriguez’s four catches conceded only 23 yards, but two moved the chains. Six of Hockenson’s eight receiving first downs came through those two matchups. This wasn’t just a string of comfortable completions that left Minnesota facing another third down.
The vulnerability extended beyond Hockenson. Brooks and Rodriguez together allowed 19 catches on 21 targets for 195 yards: 78.9% of Minnesota’s passing yardage. Everyone else in Miami’s primary coverage accounting conceded 52 yards. Brooks could earn an 85.3 run-defense grade and still finish at 46.3 in coverage; the Vikings found a weakness in a player who was doing good work elsewhere.
Those assignments don’t tell us whether each play was man coverage, zone or a matchup Kyler Murray deliberately sought before the snap. They do identify where the completions went. Hockenson caught all four of his contested targets as well, so calling the whole thing easy underneath yardage would undersell his contribution.
There’s a less flattering detail in his own report: three pressures allowed on four eligible pass-blocking opportunities, with a 17.1 blocking grade. Four opportunities are a small sample, but three disruptions are still three disruptions. His receiving work justified getting him into routes; keeping him in protection carried a cost on Sunday.
Murray supplied the middle that was missing
Against Tampa Bay, Murray completed 13 of 22 clean-pocket attempts for 126 yards and a 56.3 passer rating. Against Miami, that became 21 of 24 for 170 yards and a 96.2 rating. Include the two dropped passes and his adjusted completion percentage from those clean pockets was 95.8%: 23 of 24 attempts were charted as on target.
We’d been looking for better production when the blockers gave him a chance. Here it was, even though four sacks and no touchdown passes left plenty of frustration.
The depth split changed too. At Tampa Bay, throws travelling 10–19 yards downfield produced 10 yards on four attempts. Against Miami, Murray completed five of six for 103 yards and five first downs. Hockenson supplied 57 of those yards, but the improvement wasn’t confined to one receiver.
Minnesota attempted just one pass travelling at least 20 yards downfield, and it fell incomplete. The offense found its intermediate passing without needing a deep completion to prop up the yardage. That’s a useful change from the previous week’s dependence on the long ball. It doesn’t explain away the sacks or solve finishing drives, but it gives us something more substantial than “the quarterback looked a bit more comfortable”.
The biggest perception gap: how poorly did Murray actually throw?
The strongest mismatch for me is between the frustration with Murray and the evaluation of his passing. Daily Norseman’s recap led with “Offense Disappears Again”, while Ben Leber’s reaction described Murray as looking “paralyzed in the pocket” and discussed the stadium’s Carson Wentz chants. That’s evidence of a frustrated reaction, rather than a claim that every fan or reporter agreed; The Viking Age also picked up on the improvement late in the game.
The PFF passing grade was 83.0, with zero turnover-worthy plays. That doesn’t settle whether Murray held the ball too long, identified pressure properly or ran the offense smoothly. It does make “another poor throwing performance” a difficult verdict to square with the charting.
Even the pressure completion rate needs unpacking. Six completions on 13 attempts gives him 46.2%, which looks pretty miserable. But four of those attempts were throwaways, and he was hit as he threw on another. His adjusted completion percentage under pressure was 75.0%. That measure removes those attempts; it doesn’t credit him with moving the chains, and the four sacks remain a substantial cost.
My reading is that the anger at 15 points was justified, but it spread too easily into a judgement about every part of the quarterback’s game. The data supports better accuracy and fewer dangerous decisions alongside continuing problems with disruption and finishing drives. We should demand improvement in those problems without overlooking the passing improvement that actually happened.
Turner’s identical sack total came from a different game
Turner had five pressures and two PFF sack credits at Tampa Bay. He had five pressures and two again against Miami. Stop there and you’d miss the biggest difference: 41 rush snaps became 14.
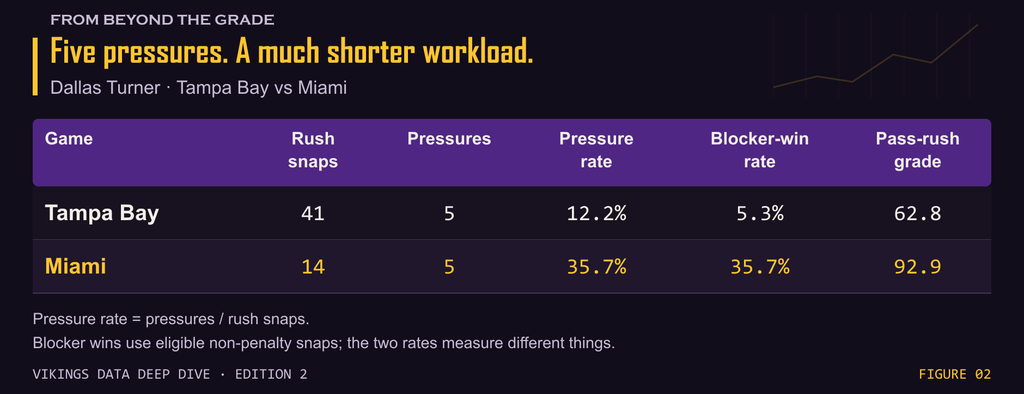
His pressure rate rose from 12.2% to 35.7%, while his blocker-win rate jumped from 5.3% to 35.7%. They’re different measures: one counts pressures per rush, the other evaluates wins against blocking on eligible non-penalty snaps. Both improved, alongside a 92.9 pass-rush grade.
There’s a sample warning here. Miami gave him only six rushes in PFF’s “true pass set” category, which excludes plays such as screens and play action, and he produced one pressure on those. Four of his five pressures came on the other eight rushes. This was an excellent use of a short workload, rather than proof he’ll beat every protection the same way. He also missed two tackles overall, so the pass-rush praise shouldn’t wash away the rest of the report.
Part 2: What the first four games now tell us
Hockenson’s revival is partly a change in how often he gets the ball
Through three games, Hockenson had 12 targets on 67 routes: a target on 17.9% of his routes. Against Miami, he had 13 on 34 (38.2%). His yards per route rose from 1.13 across the opening three games to 3.50 on Sunday.
That’s both more opportunity and better return from it. He caught nine of his first 12 targets, then all 13 against Miami. His season figure is now 195 yards on 101 routes, or 1.93 yards per route, but Sunday supplies 61.0% of those yards on 33.7% of the routes. One very good game has changed his season profile considerably; another productive workload would give us more reason to trust the improvement.
Jennings’ figures have barely moved. He’s now run 90 routes for four targets, two catches and nine yards. Against Miami, his 43 routes produced one target. The shortage begins with getting the ball, before we even reach what he does after catching it. The reports can’t divide that responsibility between separation, progression and play design, but they show Minnesota is still getting almost no direct receiving return from a substantial workload.
Play action keeps producing; screens still don’t move the chains
Minnesota’s play-action passing has produced 250 yards on 32 attempts, or 7.81 yards per attempt. Without play action, it’s 459 on 78, or 5.88. The weekly play-action averages have climbed from 3.9 to 8.2, 8.8 and now 9.5 yards per attempt.
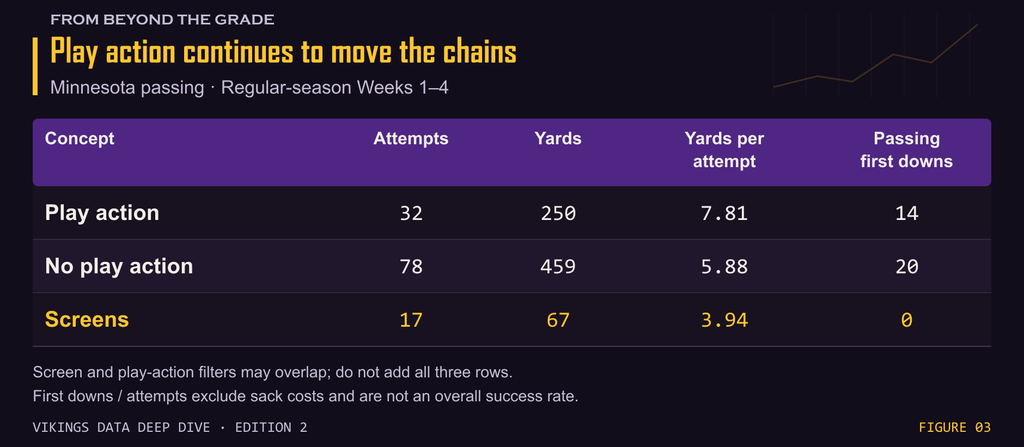
The first downs add weight to the yardage. Play action accounts for 32 of 110 attempts (29.1%), but 14 of Minnesota’s 34 passing first downs (41.2%). That’s a first down on 43.8% of play-action attempts, against 25.6% without it. These are passing-attempt figures, not a full success rate including sacks, but the advantage has survived another game.
Screens remain at zero passing first downs across 17 attempts for 67 yards. Miami added two completions for five yards on three attempts. Their share of the passing menu fell from 19.2% through three games to 8.1% on Sunday, so Minnesota leaned on them less. The remaining screen output still hasn’t justified treating a completion as an offensive success. Screen and play-action categories can overlap; those rows shouldn’t be added together.
Jones improved on both sides of first contact
Jones’ 94 yards on 20 carries lifted his season average to 4.13 yards per carry, from 3.90. More encouragingly, the improvement over Tampa Bay came almost equally before and after contact.
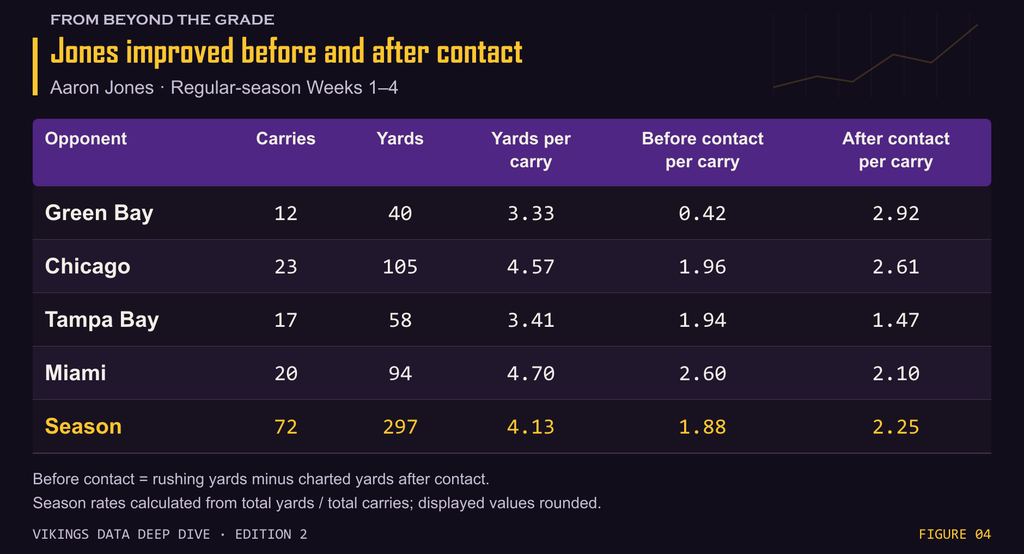
His net yards before contact rose from 1.94 to 2.60 per carry; his after-contact production rose from 1.47 to 2.10. That splits the 1.29-yard improvement in his overall average into roughly 0.66 before contact and 0.63 after. Unlike the previous week’s decline, we can’t explain this change almost entirely through what happened after a defender reached him.
There was still concentration within the better total. Five middle-right carries and three around the right edge supplied 66 of his 94 yards (70.2%). His other 12 carries gained 28 yards, or 2.33 each. The run game found productive areas, but it hasn’t become dependable everywhere, and those lane labels don’t identify one blocker as the cause.
For the next edition, I’ll be checking whether Hockenson keeps that higher target rate, whether the intermediate passing survives another opponent, and whether Jones gets the same space before contact. Those would be useful signs that Sunday moved the offense forward. Reichard is now 12-for-12 on field goals; much as we appreciate him, we’d all enjoy needing him a little less.